How to Understand Crypto Price Charts Without Becoming a Trader: Beginner's Guide 2026
Updated: Aug 19
TABLE OF CONTENT
Crypto charts can seem confusing to beginners, especially if you do not understand what a crypto exchange is or how it works before looking at price data.. Red and green candles, volume bars, and different timeframes often look overwhelming. Many new investors make decisions based on hype or fear rather than understanding the chart.
You do not need to be a trader to read crypto charts, especially when you already understand the basics of Bitcoin and how the market behaves.. Even basic chart reading can help you see price history, trends, and market activity. It can also highlight potential risks and sudden price moves.
This guide explains how to read crypto charts in a clear, beginner-friendly way. You will learn about candlesticks, trends, volume, support and resistance, moving averages, and other key concepts. By the end, you will be able to understand the story a chart tells before making investment decisions.
Key Highlights
Learning how to read crypto charts helps beginners understand price history, trends, volume, and market behavior before buying.
Line charts show the big picture, while candlestick charts give more detail about price movement during each timeframe.
Volume, support, resistance, moving averages, and volatility can help investors judge whether a price move looks strong or risky.
Bitcoin charts give useful market context because many altcoins often move with Bitcoin during major market trends.
Crypto charts cannot predict the future, so beginners should combine chart reading with tokenomics, security checks, news, and project research.
What Is a Crypto Price Chart?
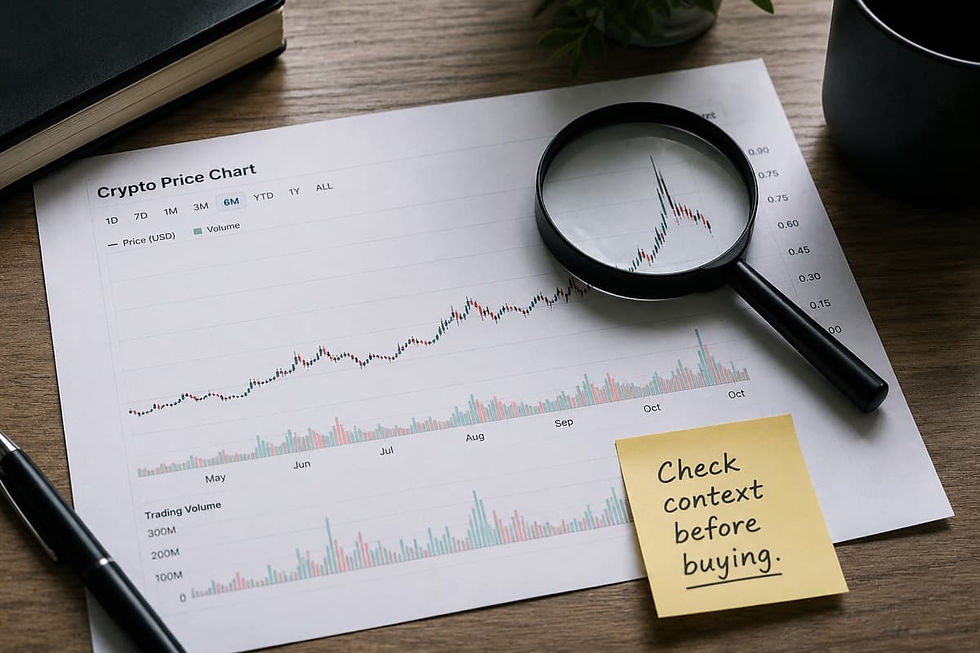
A crypto price chart is a visual representation of how a cryptocurrency’s price changes over time. It shows both current and historical price movements. Charts can include high and low prices, trading volume, trends, and market volatility. A crypto price chart is easier to understand once you know what is a blockchain and how data is recorded.
Beginners usually see price lines or candles, timeframes, volume bars, and price axes. Some charts also display indicators, all-time highs and lows, and market capitalization.
Charts matter because they provide context. They show whether a token is in an uptrend, downtrend, or sideways range. They also help beginners avoid buying blindly after a sudden price spike.
It is important to remember that a chart shows past and present behavior. It cannot guarantee future price movements. Charts are a tool to understand the market, not a crystal ball.
Why Beginners Should Learn Basic Chart Reading
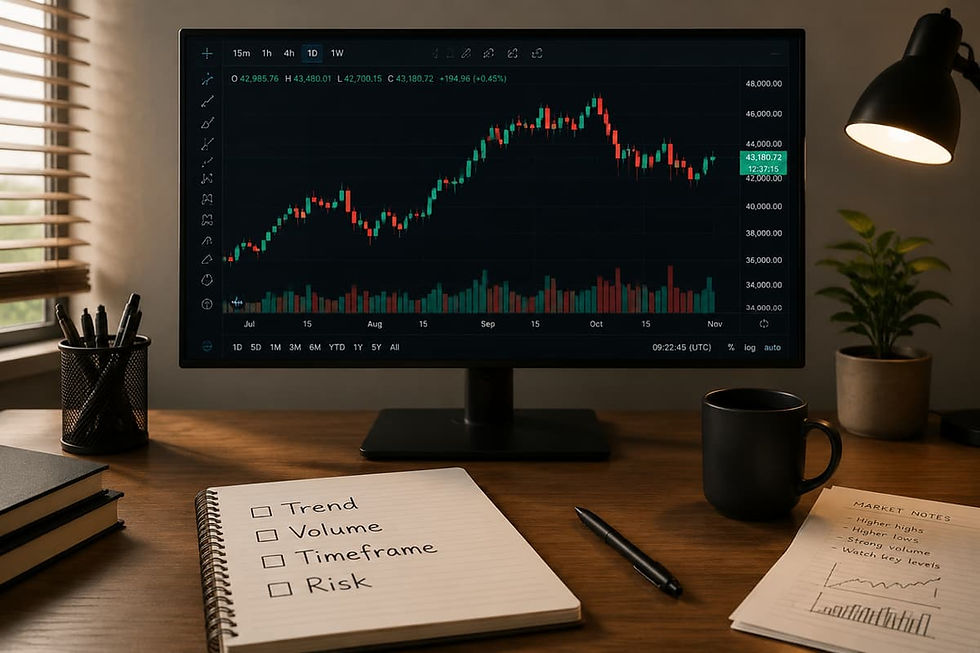
Charts show the story behind a token’s price, which becomes clearer once you understand what is technical analysis at a basic level. They reveal how the price has moved over days, weeks, or months, giving investors context beyond the current number.
1) Charts Help You Understand Price History
Many beginners look only at the current token price. Without context, this number can be misleading. A chart shows whether the asset is near all-time highs, recent lows, or moving sideways. Historical data helps investors make more informed decisions.
2) Charts Help You Avoid Emotional Buying
Some investors buy after seeing a large green candle. Fear of missing out can lead to poor choices. Basic chart reading allows you to pause and consider the bigger picture. You can assess whether the move is sustainable or a temporary spike.
3) Charts Help You Compare Risk
Two tokens may appear popular. However, their charts can tell very different stories. One may trend steadily upward. Another may experience sharp swings or repeated pumps and dumps. Comparing charts helps you evaluate potential risk before investing.
4) Charts Support Better Research
Chart analysis should complement project research. Check tokenomics, supply, market cap, and adoption metrics. Charts do not replace fundamental due diligence, but they provide a visual tool to spot trends, activity, and anomalies.
How Can Beginners Avoid Becoming Traders While Reading Crypto Charts?
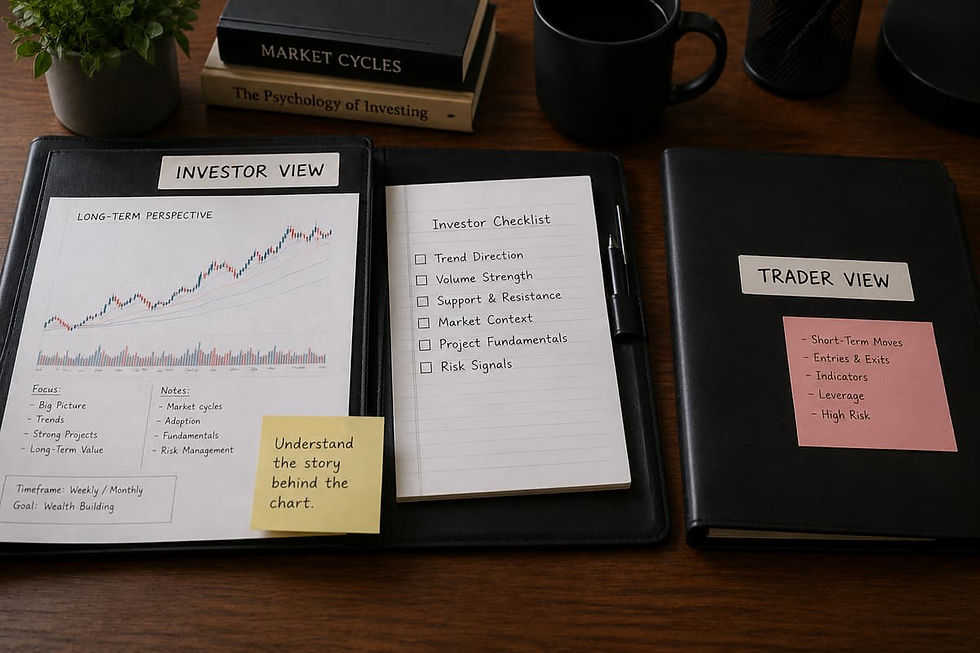
Beginner investors can understand crypto charts without learning complex trading strategies. The focus is on observing trends, volume, and price history rather than timing short-term moves or using leverage. Chart reading should provide context and awareness, not an attempt to predict every price change.
1) Investor Chart Reading vs Trader Chart Reading
Beginner investors focus on understanding price history and identifying major trends. They avoid buying after hype and check volume and volatility to make informed decisions.
Traders, by contrast, time entries and exits, use technical strategies, trade short-term moves, and often rely on leverage or derivatives.
Investor Chart Reading | Trader Chart Reading |
Understand price history | Time entries and exits |
Identify major trends | Use technical strategies |
Avoid buying after hype | Trade short-term moves |
Check volume and volatility | Use leverage or derivatives |
Support long-term research | Seek frequent profit opportunities |
2) Awareness, Not Prediction
For beginners, the goal is awareness rather than prediction. Charts help reveal market strength, weakness, hype, or risk. Investors do not need to forecast every candle or anticipate daily price swings.
3) How Can Beginners Keep It Simple?
A beginner should concentrate on trend direction, timeframe, volume, volatility, major price levels, and recent pumps or crashes. This approach gives enough insight to make informed decisions without delving into advanced trading techniques.
What Is the Difference Between Line Charts and Candlestick Charts?
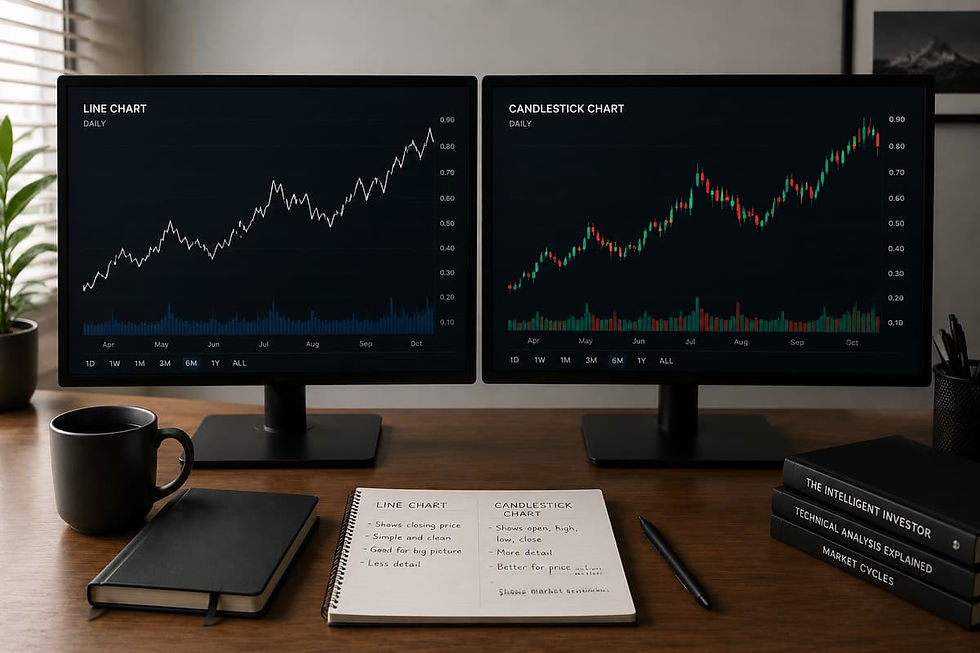
Before learning how to read crypto charts in detail, it is important to understand the two most common chart types. Most crypto platforms allow users to switch between line charts and candlestick charts. Each serves a different purpose and can help beginners understand market behavior.
1) What Is a Line Chart?
A line chart connects closing prices over a selected period. It creates a simple visual representation of price movement. Many beginners prefer line charts because they are easy to read and remove much of the noise seen in other chart types.
Line charts are useful when you want to understand the overall direction of a cryptocurrency. They help investors quickly identify whether an asset has been rising, falling, or moving sideways over time.
2) What Is a Candlestick Chart?
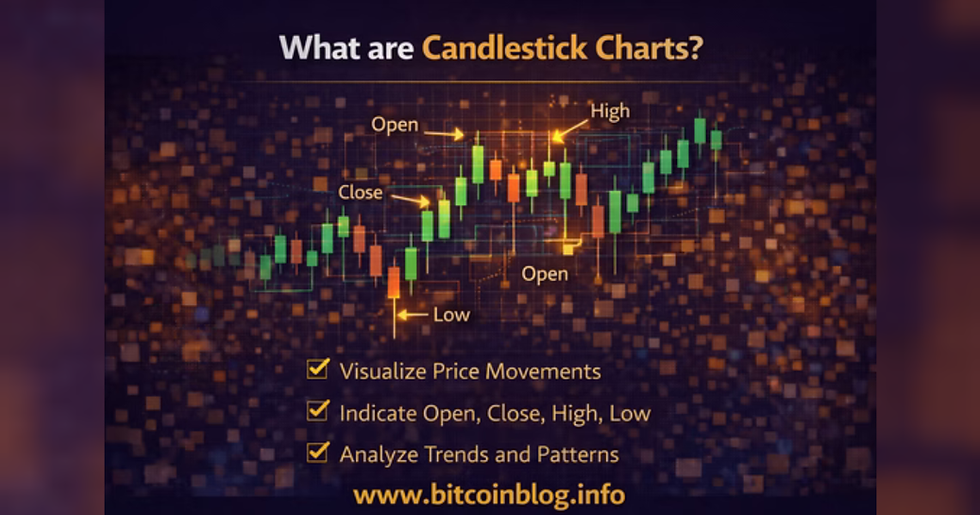
A candlestick chart provides more information than a line chart. Each candle represents price activity during a specific timeframe. Instead of showing only the closing price, it displays the opening price, closing price, highest price, and lowest price during that period.
This additional information helps investors understand market behavior in greater detail. Candlestick charts can reveal buying pressure, selling pressure, and changes in market sentiment.
3) Which Chart Type Is Better for Beginners?
Both chart types have value. A line chart is easier to understand and works well for viewing long-term price history. A candlestick chart provides deeper insights into price movement and volatility.
Many beginners start with line charts because they are less intimidating. Once they become comfortable reading trends, they can switch to candlestick charts for a more detailed view of the market.
4) How Should Beginners Use These Charts?
A simple approach is to use line charts to understand the bigger picture. They make it easier to spot long-term trends and major price movements.
After identifying the overall trend, investors can use candlestick charts to study recent price action more closely. This combination provides a clearer understanding of both the broader market direction and short-term behavior.
How Do You Read a Crypto Candlestick?
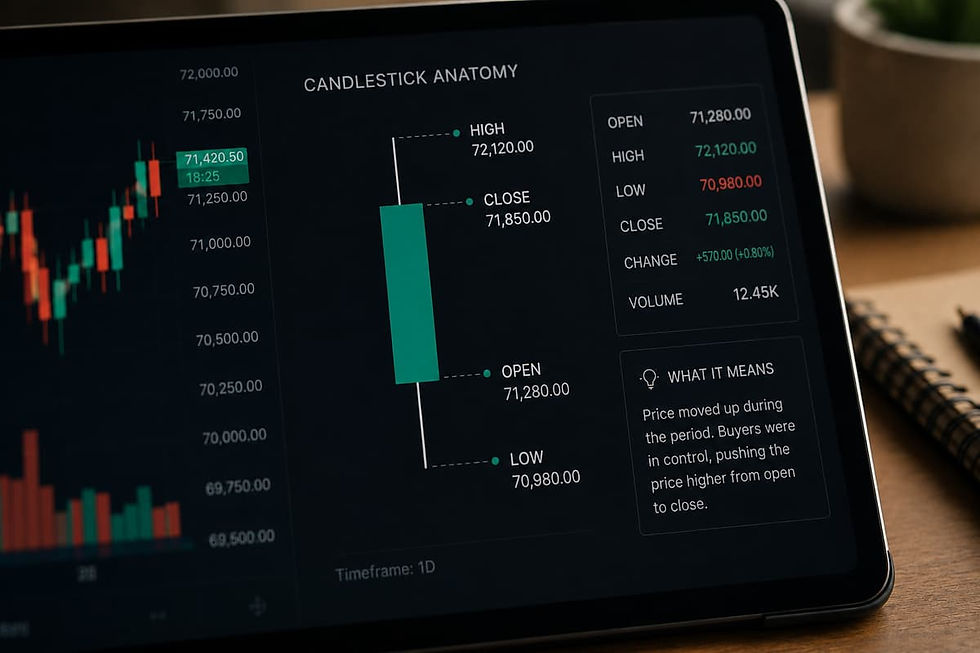
Candlestick charts are one of the most common ways to visualize crypto price movements. Everything becomes easier when you first understand what are candlestick charts in detail. Each candlestick represents price activity for a specific timeframe. Learning to read them helps beginners understand market behavior without relying on complex trading strategies.
1) Four Parts of a Candlestick
A candlestick shows four price points: the opening price, the closing price, the highest price, and the lowest price during the selected period. The body of the candle represents the range between the open and close, while the wicks, or shadows, show the highs and lows.
2) Candle Body
The candle body indicates whether the price increased or decreased during the period. A larger body usually signals stronger buying or selling activity, while a smaller body suggests indecision or low volatility.
3) Candle Wick or Shadow
The wicks show how far the price moved above or below the opening and closing levels. A long wick can indicate rejection of higher or lower prices. For example, a long upper wick suggests sellers pushed the price down after an initial rise.
4) How Should Beginners Interpret Candles?
One candle alone does not tell the full story. Beginners should observe multiple candles, volume, and overall trends. Candlestick patterns are most useful when combined with other chart information, such as support and resistance or market context.
How Do Green and Red Candles Help You Understand Market Sentiment?
After learning the basic structure of a candlestick, the next step is understanding what different candle colors mean. Green and red candles provide a quick snapshot of whether buyers or sellers were stronger during a specific period.
1) What Does a Green Candle Mean?
A green candle usually means the price closed higher than it opened. This shows that buyers were willing to pay higher prices during that timeframe.
A single green candle often indicates positive momentum. However, it does not automatically mean the market will continue moving higher.
2) What Does a Red Candle Mean?
A red candle usually means the price closed lower than it opened. This suggests that sellers had more control during that period.
A red candle can signal weakness, but it should not be viewed as proof that a major decline is starting.
3) Why Does Candle Size Matter?
The size of a candle can reveal the strength of a price move. A large candle often shows strong buying or selling activity. A small candle usually suggests uncertainty or limited market participation.
When several large candles appear in the same direction, it may indicate strong momentum. However, investors should still consider volume and broader market conditions.
4) Why Should You Avoid Reacting to a Single Candle?
Many beginners make decisions based on one candle. This approach can be risky. Markets often produce short-term moves that do not reflect the bigger trend.
A single green candle does not guarantee future gains. Likewise, a single red candle does not guarantee a market crash.
5) What Context Should You Check Before Making a Decision?
Candles become more meaningful when viewed within the broader market context. Investors should consider the overall trend, recent volume activity, nearby support and resistance levels, and major market news.
Looking at the bigger picture helps beginners avoid emotional decisions and understand what the chart is actually showing.
How Do You Choose the Right Chart Timeframe?

Timeframes show the period each candle or data point represents. Choosing the right timeframe is important for beginners because it affects how you interpret price movements. Shorter timeframes show more detail, while longer timeframes reveal broHow Do You Understand Crypto Trendsader trends.
Timeframe selection becomes more meaningful when combined with basic technical analysis concepts used across crypto markets.
1) What Is a Short Timeframe?
Short timeframes, such as 5-minute, 15-minute, or 1-hour charts, show detailed price movements. They are useful for active traders but can appear noisy and confusing for beginners. Rapid price swings on these charts may lead to emotional decisions.
2) What Is a Long Timeframe?
Longer timeframes, such as daily, weekly, or monthly charts, show the bigger picture. They smooth out short-term fluctuations and make it easier to identify trends and major price levels. Beginners often benefit from focusing on longer timeframes to understand market direction.
3) Which Timeframes Are Best for Beginners?
For most beginner investors, daily and weekly charts are sufficient. They provide a clear view of recent trends and long-term behavior. Monthly or one-year charts can help understand the overall market cycle and avoid reacting to temporary volatility.
4) How Should Beginners Use Timeframes Effectively?
Beginners should avoid making decisions based solely on short-term charts. Start with a long-term view to see the overall trend. Then, use shorter timeframes to study recent activity if needed. This approach reduces the risk of emotional trading and provides context for investment decisions.
How Do You Understand Crypto Trends?
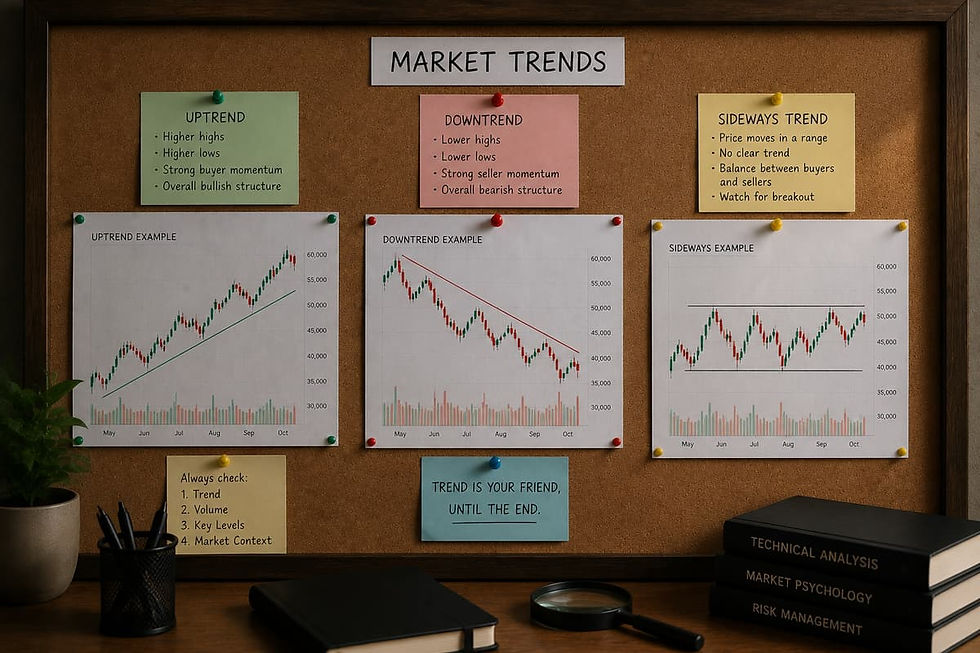
A trend shows the general direction of a crypto asset over time. It helps beginners see whether the market is gaining strength, losing strength, or moving without a clear direction. Understanding trends is a key part of learning how to read crypto charts.
Understanding trends becomes more accurate when you also know how stablecoins influence liquidity and market stability.
1) What Is an Uptrend?
An uptrend means the price is generally moving higher over time. The chart often shows higher highs and higher lows. This means buyers are stepping in at stronger price levels.
An uptrend can show growing interest in an asset. However, beginners should still check volume and recent price movement. A strong uptrend can also become risky if the price rises too fast.
2) What Is a Downtrend?
A downtrend means the price is generally moving lower over time. The chart often shows lower highs and lower lows. This suggests that sellers are still active.
Many beginners think a falling token is cheap. This can be a mistake. A token in a long downtrend may continue falling if demand is weak.
3) What Is a Sideways Trend?
A sideways trend means the price is moving within a range. It does not show a clear upward or downward direction. The market may be waiting for stronger buying or selling activity.
Sideways movement is common after large price moves. It can also happen when investors are uncertain about the next direction.
4) Why Do Trends Matter for Beginners?
Trends help beginners avoid buying blindly. A chart can show whether a token is gaining momentum or losing market interest. It can also show whether the current price move fits the larger market direction.
Before buying, investors should look at the trend on daily and weekly charts. This gives better context than short-term movements. A clear trend can help investors make better decisions, but it still cannot guarantee future price action.
What Does Trading Volume Mean on a Crypto Chart?
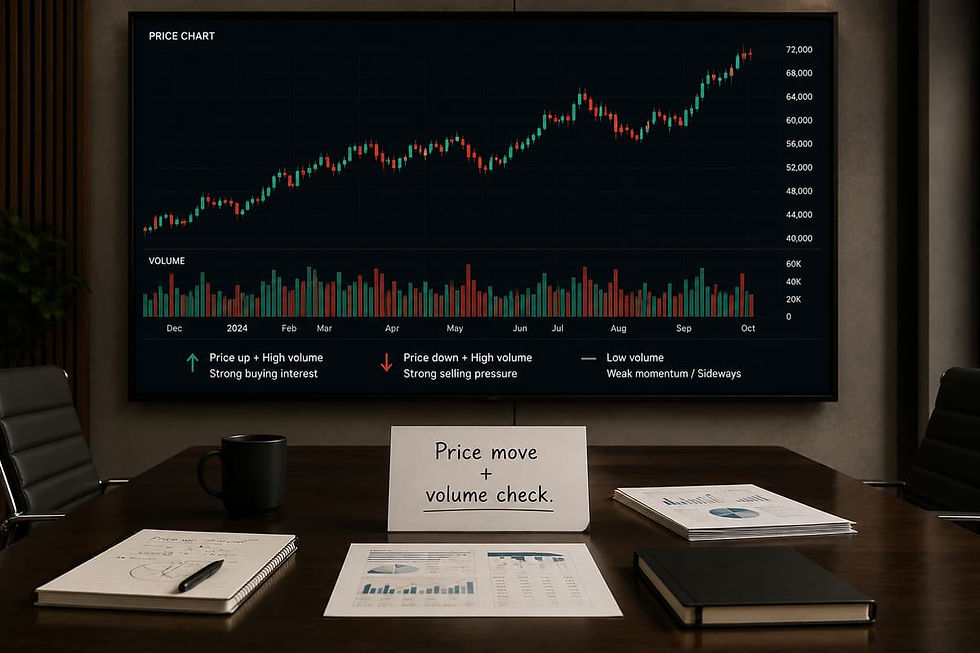
Trading volume shows how much of a crypto asset was traded during a selected period. It helps beginners understand whether a price move has strong market activity behind it. Volume is one of the most important signals when learning how to read crypto charts.
1) Why Is Trading Volume Important?
Price alone does not show the full picture. A token may rise quickly, but the move may be weak if only a small number of people are trading it.
Volume helps show the level of interest in the asset. Higher volume often means more buyers and sellers are active. Lower volume may suggest weak interest or poor liquidity.
2) What Does Price Up With Volume Up Mean?
When price rises with higher volume, it may show stronger buying interest. More market participants are involved in the move. This can make the price action more meaningful.
However, beginners should not treat this as a guaranteed bullish signal. The move may still be driven by short-term hype or market news.
3) What Does Price Up With Volume Down Mean?
When price rises but volume falls, the move may be weaker. It can suggest that fewer buyers are supporting the price increase.
This does not always mean the price will fall. But it is a sign that beginners should research further before making a decision.
4) What Does Price Down With Volume Up Mean?
When price falls with higher volume, it may show strong selling pressure. This can happen during panic selling, bad news, or a wider market decline.
A sharp fall with high volume needs caution. It may mean large holders or many investors are exiting the asset.
5) What Does Price Down With Volume Down Mean?
When price falls with lower volume, it may show fading interest. The market may be quiet, or investors may be waiting for clearer direction.
This signal depends on the broader chart. Beginners should compare it with the trend, recent news, and Bitcoin’s movement.
Why Should Beginners Be Careful With Volume Data?
Volume can differ across exchanges. Some small tokens may also show unreliable trading activity. This is why beginners should check volume on trusted platforms and compare data from more than one source.
Volume is useful, but it should not be used alone. It works best with trend, timeframe, volatility, and support and resistance. This makes it easier to understand the real strength behind a price move.
What Are Support and Resistance in Crypto Charts?

Support and resistance are key price areas on a crypto chart. They show where buyers or sellers have reacted in the past. These levels help beginners understand where the market may slow down, reverse, or become more active.
Support and resistance zones become more practical when you understand how liquidity impacts price volatility in crypto markets.
1) What Is Support?
Support is a price area where buyers have stepped in before. It often appears when the price falls to a certain level and then starts rising again.
For example, if Bitcoin falls near a certain price several times and bounces back, that area may become support. It shows that buyers may see value at that level.
Support does not mean the price cannot fall lower. It only shows that the market has reacted there before.
2) What Is Resistance?
Resistance is a price area where sellers have appeared before. It often appears when the price rises to a certain level and then falls back.
For example, if a token rises near the same price several times but fails to move higher, that area may become resistance. It shows that sellers may be active at that level.
Resistance does not mean the price cannot move higher. It only shows that the market has struggled there before.
3) Why Do Support and Resistance Matter?
Support and resistance help beginners understand price behavior. They show where the market has shown strong reactions in the past.
These areas can also help investors avoid emotional buying. Buying near strong resistance after a large pump may carry higher risk. Buying near support may still be risky if the broader trend is weak.
4) Are Support and Resistance Exact Numbers?
Support and resistance are not exact numbers. They are better viewed as zones. Crypto prices move fast, and the market may briefly move above or below these levels.
Beginners should not assume that support will always hold. They should also not assume that resistance will always stop a price move.
5) How Should Beginners Use These Levels?
Beginners should use support and resistance as part of a wider chart view. These levels are more useful when combined with trend, volume, and market conditions.
This is an important part of learning how to read crypto charts. Support and resistance can show where price has reacted before, but they cannot predict the future with certainty.
What Are Moving Averages in Crypto Charts?
Moving averages help smooth price data on a crypto chart. They make it easier to see the broader trend without reacting to every small price move. For beginners, moving averages can be useful when learning how to read crypto charts with more clarity.
Moving averages are easier to interpret when paired with structured rule-based crypto trading strategies.
1) What Is a Moving Average?
A moving average shows the average price of a crypto asset over a selected period. For example, a 50-day moving average shows the average price over the last 50 days.
The line changes as new price data comes in. This helps reduce short-term noise and shows whether the price is generally moving higher or lower.
2) What Are Common Moving Averages?
Beginner investors often see the 50-day, 100-day, and 200-day moving averages on crypto charts. These are widely used to study medium-term and long-term trends.
The 50-day moving average is often used to check recent trend strength. The 200-day moving average is often used to understand the broader market trend.
3) What Does Price Above a Moving Average Mean?
When the price stays above a moving average, it may show stronger market conditions. It often means buyers have been active enough to keep the price above its recent average.
This can be a positive signal, but it should not be used alone. Beginners should also check volume, trend direction, and market conditions.
4) What Does Price Below a Moving Average Mean?
When the price stays below a moving average, it may show weaker market conditions. It often means the asset is struggling to regain strength.
A price below the moving average does not always mean the token will keep falling. But it is a signal that investors should study the chart more carefully.
5) What Should Beginners Remember About Moving Averages?
Moving averages are delayed indicators. They follow price action. They do not predict future price with certainty.
Beginners should use them as a simple trend tool. They work best when combined with price history, volume, support, resistance, and broader market research.
How Do You Spot Volatility on a Crypto Chart?
Volatility shows how fast and how sharply a crypto price moves. It is one of the biggest risks in crypto investing. Beginners should understand volatility before buying any asset. High volatility becomes easier to evaluate once you understand how crypto fees and gas fees affect market behavior and trading decisions.
1) What Is Volatility?
Volatility means the price moves up or down quickly. A highly volatile crypto asset can rise fast and fall just as fast.
Crypto markets are often more volatile than traditional markets. Prices can react strongly to news, social media, liquidity changes, Bitcoin movement, and investor sentiment.
2) What Are the Signs of High Volatility?
High volatility is easy to spot on a chart. Large candles often show strong price movement. Long wicks can show that the price moved sharply before pulling back.
A chart with sudden pumps and quick crashes may also show high volatility. Big daily percentage changes are another warning sign.
3) Why Does Volatility Matter for Beginners?
High volatility can create opportunity, but it also increases risk. A beginner may buy after a fast price rise and then face a quick correction.
This is common in small altcoins. These assets may have lower liquidity and stronger price swings than Bitcoin or Ethereum.
4) How Can Beginners Use Volatility Before Buying?
Before buying, check whether the price has moved too far in a short time. A sudden pump may look exciting, but it may also mean the asset is overextended.
Beginners should also compare volatility across timeframes. A chart may look calm on a weekly view but risky on a daily view.
5) What Is the Key Lesson About Volatility?
Volatility is not always bad. It is part of crypto markets. But it should be understood clearly.
Learning how to read crypto charts helps beginners see whether price movement is stable, risky, or driven by short-term hype. A volatile chart should lead to more research, not faster buying.
How Do You Read Bitcoin Charts vs Altcoin Charts?
Bitcoin and altcoin charts can look similar, but they do not always behave in the same way. Bitcoin often acts as the main reference point for the crypto market. Altcoins can move faster, but they usually carry higher risk.
Bitcoin vs altcoin behavior becomes clearer when you first understand Bitcoin’s role in overall market movement and price cycles.
1) Why Does Bitcoin Matter in Crypto Chart Reading?
Bitcoin is the largest and most watched crypto asset. Its price movement often affects the wider market. When Bitcoin rises strongly, many altcoins may also move higher.
When Bitcoin falls sharply, altcoins often face stronger selling pressure. This happens because market confidence usually weakens during Bitcoin sell-offs.
Beginners should check the Bitcoin chart before studying smaller tokens. It gives useful context about the broader crypto market.
2) Why Are Altcoin Charts More Volatile?
Altcoins often have smaller market caps and lower liquidity than Bitcoin. This means their prices can move more sharply. A small increase in buying or selling can cause a large price change.
Some altcoins rise quickly during hype cycles. But they can also fall fast when interest fades. This makes chart reading more important for beginner investors.
3) Why Should You Compare Altcoins With Bitcoin?
Many beginners check only the dollar price of an altcoin. This can be misleading. A token may rise against the dollar but still perform worse than Bitcoin.
Comparing an altcoin against Bitcoin can show whether it is truly gaining strength. If the token is rising in dollar terms but falling against Bitcoin, it may not be outperforming the broader market.
4) What Should Beginners Watch on Altcoin Charts?
Beginners should look for strong trends, healthy volume, and clear market interest. They should also check whether the move is linked to real news or only short-term hype.
A sharp pump with weak volume can be risky. A long downtrend with no recovery can also be risky. Altcoin charts need extra care because price swings can be severe.
5) What Is the Key Lesson?
Bitcoin charts help beginners understand the overall crypto market. Altcoin charts help them study specific asset risk.
Learning how to read crypto charts means looking at both. A token should not be judged in isolation. It should be compared with Bitcoin, the wider market, and its own price history.
How Can You Use Charts Before Buying Crypto?
A crypto chart should not be the only reason to buy an asset. It should help investors understand price context before making a decision. This is one of the most practical parts of learning how to read crypto charts.
Before using charts for buying decisions, it helps to understand how to build a diversified crypto portfolio from scratch.
1) Start by Zooming Out
Beginners should first look at the long-term chart. A one-year or all-time view can show where the asset stands in its larger price cycle.
This helps investors avoid judging a token only by recent movement. A short-term rise may look strong, but the long-term chart may still show a major downtrend.
2) Check the Current Trend
The next step is to study the trend. The asset may be moving upward, falling, or trading sideways.
An uptrend can show strength, but it may also become risky if the price has already risen too much. A downtrend can make the price look cheap, but it may also show weak demand.
3) Study Recent Price Movement
Recent price action can reveal important warning signs. If a token has pumped sharply in a few days, beginners should slow down and check why it moved.
A sudden price rise may come from real news, exchange listings, or market-wide momentum. It may also come from hype. A chart helps investors see whether the move looks stable or extreme.
4) Check Trading Volume
Volume helps confirm whether a price move has strong market activity behind it. A price rise with rising volume may show stronger interest.
A price rise with weak volume may need more caution. It can mean fewer buyers are supporting the move. Beginners should not ignore volume when studying crypto price charts.
5) Compare With Bitcoin and the Sector
A token should not be studied alone. Beginners should compare it with Bitcoin and similar crypto assets.
If the whole market is rising, the token’s move may not be unique. If the token is rising while Bitcoin is weak, investors should research what is driving the move.
6) Combine Charts With Fundamental Research
Chart reading should support research, not replace it. Investors should also study the project, tokenomics, supply, market cap, token unlocks, liquidity, security, and adoption.
A chart can show price behavior. It cannot show whether the project is strong. This is why beginners should use charts as one part of a wider research process.
7) Make a Simple Risk View
After checking the chart, beginners should form a basic risk view. The asset may look stable, risky, overextended, or weak.
This does not mean the chart can predict the future. It only helps investors avoid buying blindly. The goal is to understand the chart before making any crypto investment decision.
What Can Crypto Charts Not Tell You?
Crypto charts are useful, but they have limits. Charts cannot reveal hidden risks like crypto scams and impersonation schemes that impact investor safety.
They can show price history and market behavior. They cannot show the full risk behind a crypto asset. Beginners should understand these limits before using charts to make investment decisions.
1) Charts Cannot Guarantee Future Price
A chart shows what has already happened. It does not guarantee what will happen next.
A token may show a strong uptrend and still fall later. It may also show weakness and then recover. Crypto prices can change quickly because of news, liquidity, Bitcoin movement, or market sentiment.
This is why chart reading should never be treated as certain.
2) Charts Cannot Prove a Project Is Strong
A good-looking chart does not always mean a strong project. Some tokens rise because of hype, paid promotion, or short-term speculation.
The chart may look positive for a few days or weeks. But the project may still have weak utility, poor adoption, or unclear long-term value.
Beginners should not judge a crypto asset only by price movement.
3) Charts Cannot Show Full Tokenomics Risk
Tokenomics can affect future price action. But many tokenomics risks are not visible on the chart.
A chart may not clearly show upcoming token unlocks, insider allocations, inflation, or future supply pressure. A token can look strong before a large unlock event. After new supply enters the market, selling pressure may increase.
This is why investors should always check supply data along with the chart.
4) Charts Cannot Replace Security Research
A chart cannot show whether a smart contract is safe. It also cannot show whether the project has been audited or whether the team controls important parts of the system.
Some projects may have rising prices before a hack or exploit. Others may look active but carry hidden security risks.
Security checks are essential before buying any crypto asset.
5) Charts Cannot Protect Against News Shocks
Crypto prices can react sharply to sudden events. These events may include hacks, exchange delistings, lawsuits, regulatory action, or major market crashes.
A chart may look stable before bad news appears. Once the news breaks, price behavior can change quickly.
Beginners should always combine chart reading with news checks and broader market research.
6) What Is the Key Lesson?
Charts should be used as one part of crypto research. They can help investors understand price behavior, but they cannot explain everything.
Learning how to read crypto charts is useful. But it should always be combined with project research, tokenomics, security checks, and risk management.
What Common Mistakes Do Beginners Make When Reading Crypto Charts?
Many beginners make fast decisions after looking at only one part of a chart. This can lead to poor timing and higher risk. Crypto charts should be read with patience, context, and caution.
Most beginner mistakes come from ignoring basic crypto security practices and risk protection strategies.
1) Buying Only Because the Chart Is Green
A green chart can create fear of missing out. Many beginners buy after a token has already moved sharply higher.
This can be risky because the price may already be overextended. A strong green candle does not always mean the move will continue. It may also appear near the end of a short-term rally.
2) Thinking a Big Drop Means a Bargain
A token that has fallen 70% or 90% may look cheap. But a large drop does not always mean value.
The project may have weak demand, poor tokenomics, low liquidity, or falling user interest. A falling chart should lead to deeper research, not automatic buying.
3) Using Very Short Timeframes
Short timeframes can be confusing for beginners. A 5-minute or 15-minute chart may show sharp moves that look important but mean very little in the bigger picture.
Beginners should focus more on daily, weekly, and monthly charts. Longer timeframes help reduce noise and show the broader trend more clearly.
4) Ignoring Trading Volume
Price movement without volume can be misleading. A token may rise, but the move may not have strong market support.
Volume helps show whether buyers and sellers are active. Ignoring it can lead beginners to trust weak price moves.
5) Ignoring the Broader Crypto Market
A token may rise because the whole crypto market is rising. It may fall because Bitcoin is falling.
Beginners should not study one chart in isolation. Bitcoin, Ethereum, and the wider market often influence altcoin price action.
6) Treating Support and Resistance as Exact Numbers
Support and resistance are zones, not fixed numbers. Crypto prices can briefly move above or below these areas before changing direction.
Beginners often expect these levels to work perfectly. This can create false confidence. These zones should be used with trend, volume, and market context.
7) Using Too Many Indicators
Too many indicators can make chart reading harder. Beginners may add several lines, signals, and tools without understanding them.
A simpler approach is usually better. Price history, trend, volume, volatility, and major price areas are enough for basic chart reading.
8) Confusing Chart Reading With Certainty
No chart pattern works every time. Crypto markets can change quickly due to news, sentiment, liquidity, or regulation.
Learning how to read crypto charts helps reduce blind decisions. It does not remove risk or guarantee profit.
9) Forgetting Tokenomics
A chart may look strong before a major token unlock. It may also rise while future supply risk remains high.
Beginners should check supply, FDV, unlock schedules, and insider allocation. These factors can affect future price pressure.
10) Becoming a Trader Without a Plan
Some beginners start with basic chart reading and slowly move into short-term trading. They may begin using leverage, futures, or risky strategies without enough knowledge.
This can lead to fast losses. The goal of beginner chart reading is not day trading. The goal is to understand price context before buying or avoiding a crypto asset.
What Is a Beginner Crypto Chart Reading Checklist?

A checklist helps beginners read crypto charts in a more structured way. It reduces emotional decisions and makes the research process clearer. The goal is not to predict the market. The goal is to understand price behavior before buying.
A proper checklist becomes more effective when combined with risk management techniques for crypto portfolios.
1) Check the Big Picture First
Start with the long-term chart. Look at the one-year view or all-time view before focusing on recent candles.
This helps you see whether the asset is near its highs, near its lows, or stuck in a long downtrend. A token may look strong on a short-term chart but weak on a long-term chart.
Beginners should also check whether the token has recently pumped. A sharp rise in a short period can increase risk. It may mean the easy move has already happened.
2) Check the Current Trend
The next step is to study the trend. Ask whether the asset is moving upward, downward, or sideways.
An uptrend can show stronger demand. A downtrend can show weakness. A sideways trend may show uncertainty or a pause before the next major move.
The trend should be checked on daily and weekly charts. Short-term charts can create confusion and may not show the real market direction.
3) Check Trading Volume
Volume helps confirm whether a price move has strong activity behind it. A rising price with rising volume may show stronger interest.
A rising price with weak volume may need caution. It can mean fewer buyers are supporting the move.
Beginners should also check if volume is stable or suddenly spiking. A sudden volume spike can come from news, hype, or panic.
4) Check Volatility
Volatility shows how risky the price movement may be. Large candles, long wicks, and sharp price swings can signal high volatility.
A highly volatile token can rise quickly. It can also fall quickly. This is common in small altcoins with low liquidity.
Before buying, beginners should ask whether the price movement fits their risk level. A chart that looks too unstable may need more research.
5) Check Support and Resistance
Support and resistance show where price reacted in the past. These areas can help beginners understand important price zones.
Support may show where buyers were active. Resistance may show where sellers appeared.
These zones are not guaranteed. They can fail at any time. Beginners should use them with trend and volume instead of treating them as fixed price points.
6) Check Bitcoin and Market Context
A token’s chart should not be studied alone. Bitcoin often affects the wider crypto market.
If Bitcoin is falling, altcoins may face more pressure. If Bitcoin is rising, many tokens may move higher with the market.
Beginners should also compare the token with similar projects in the same sector. This helps show whether the asset is truly strong or only following the market.
7) Check Key Risk Signals
Charts can show price behavior, but they do not show every risk. Before buying, investors should check for token unlocks, weak liquidity, major news, security issues, and broader market weakness.
A chart may look positive while hidden risks remain. This is why chart reading should always be combined with project research.
8) Follow the Final Beginner Rule
A chart should help you ask better questions. It should not give blind confidence.
Learning how to read crypto charts means understanding context. It helps beginners avoid hype, panic, and rushed decisions.
What Is a Simple Crypto Chart Analysis Framework for Beginners?
A simple framework helps beginners study crypto charts step by step. It keeps the process clear and reduces guesswork. This method can be used before buying Bitcoin, Ethereum, or any altcoin.
This framework becomes stronger when paired with order book behavior, liquidity depth, and slippage analysis.
1) Start With the Long-Term Chart
The first step is to zoom out. Check the one-year chart or the all-time chart before looking at recent price action.
This shows the larger price story. The asset may look strong on a daily chart, but the long-term chart may show a deep downtrend.
Beginners should check whether the token is near its all-time high or far below it. They should also check whether the asset has recovered from past declines.
2) Check the Recent Trend
After studying the long-term chart, check the daily or weekly trend. Look at whether the price is rising, falling, or moving sideways.
A rising trend may show strength. A falling trend may show weak demand. A sideways trend may show that the market is waiting for a clear direction.
The recent trend should always be compared with the larger chart. This helps avoid decisions based only on short-term moves.
3) Study Trading Volume
Volume shows how much activity is behind the price move. If price rises with strong volume, the move may have more support.
If price rises with weak volume, the move may be less reliable. It may be driven by short-term hype or low liquidity.
Beginners should also check whether volume comes from trusted exchanges. Poor-quality volume can make a chart look stronger than it really is.
4) Identify Major Price Zones
The next step is to identify important price zones. These are areas where the price reacted several times in the past.
A lower zone may act as support. A higher zone may act as resistance. These zones can help beginners understand where buyers or sellers may become active.
These levels should not be treated as fixed numbers. Crypto prices often move above or below them before settling.
5) Compare With Bitcoin
Bitcoin often affects the wider crypto market. Before judging an altcoin chart, beginners should check what Bitcoin is doing.
If Bitcoin is rising, many altcoins may rise with it. If Bitcoin is falling, smaller tokens may face stronger pressure.
A token that performs better than Bitcoin may show stronger demand. A token that rises in dollar terms but falls against Bitcoin may not be truly strong.
6) Check News and Market Events
Price movement may be linked to recent news. This can include exchange listings, token unlocks, product launches, hacks, partnerships, or regulatory updates.
A chart can show that price moved. It cannot always show why it moved.
Beginners should check reliable news sources before making any decision based only on the chart.
7) Combine the Chart With Project Research
Chart reading is only one part of crypto research. Investors should also study the project, tokenomics, supply, liquidity, security, team, and adoption.
Learning how to read crypto charts helps beginners understand price behavior. But a strong chart does not always mean a strong project.
8) Make a Simple Risk View
After reviewing the chart, beginners should create a simple risk view. The asset may look strong, weak, overextended, volatile, or unclear.
This final step helps investors slow down. It also helps them avoid buying only because the price is moving fast.
FAQs About Reading Crypto Charts
1) How Do Beginners Read Crypto Charts?
Beginners should start with the basic chart view. First, check the timeframe. Then study the overall trend, recent price movement, trading volume, and volatility.
The goal is not to predict the next move. The goal is to understand whether the asset looks strong, weak, risky, or overextended.
2) Do You Need Technical Analysis to Invest in Crypto?
No, beginner investors do not need advanced technical analysis. They do not need to learn every indicator or chart pattern.
Basic chart reading is enough to understand price history and market behavior. It should be combined with project research, tokenomics, security checks, and risk management.
3) What Is a Crypto Candlestick Chart?
A crypto candlestick chart shows price movement during a selected period. Each candle usually shows the opening price, closing price, highest price, and lowest price.
This helps investors understand how the price moved during that timeframe. It also shows whether buyers or sellers were stronger during that period.
4) What Do Green and Red Candles Mean in Crypto?
A green candle usually means the price closed higher than it opened. This suggests stronger buying activity during that period.
A red candle usually means the price closed lower than it opened. This suggests stronger selling activity during that period.
One candle should not be used alone. Beginners should always check the broader trend and volume.
5) What Is the Best Timeframe for Beginner Crypto Investors?
Daily, weekly, and monthly charts are usually better for beginners. These timeframes show the broader trend more clearly.
Short timeframes, such as 5-minute or 15-minute charts, can be noisy. They are often used by active traders. Beginner investors may find them confusing.
6) What Does Volume Mean on a Crypto Chart?
Volume shows how much of a crypto asset was traded during a selected period. It helps show whether a price move has strong market activity behind it.
A price rise with strong volume may show healthy interest. A price rise with weak volume may need more caution.
7) What Is Support in Crypto Charts?
Support is a price area where buyers have reacted in the past. It often appears when the price falls to a level and then moves higher again.
Support is not guaranteed. It can break if selling pressure becomes stronger.
8) What Is Resistance in Crypto Charts?
Resistance is a price area where sellers have reacted in the past. It often appears when the price rises to a level and then fails to move higher.
Resistance can also break. If buyers become stronger, the price may move above that area.
9) Can Crypto Charts Predict the Future?
No, crypto charts cannot predict the future with certainty. They show past and current price behavior.
Charts can help investors understand trends, volume, volatility, and market reactions. But they cannot guarantee future price movement.
10) Should You Buy Crypto When the Chart Is Going Up?
Not automatically. A rising chart may show strength. It may also mean the asset has already pumped.
Beginners should check volume, trend, Bitcoin movement, tokenomics, and recent news before buying. A fast price rise should lead to more research, not rushed decisions.
Final Thoughts!
Learning how to read crypto charts does not mean you need to become a trader. For beginners, chart reading is mainly about understanding context. It helps investors see where price has been, how strong the trend looks, and whether the asset may be risky at the current level.
Crypto charts can show price history, volume, volatility, support, resistance, and market direction. These signals can help beginners avoid emotional buying. They can also reduce the chance of buying only because of hype or fear of missing out.
Still, charts should never be used alone. A strong chart does not always mean a strong project. A weak chart does not always mean there is no future recovery. Investors should also study tokenomics, supply, liquidity, security, adoption, news, and broader market conditions.
The main goal is not to predict every candle. The goal is to avoid buying blindly. A simple chart review can help beginners ask better questions before making any crypto investment decision.
In the end, how to read crypto charts is a basic skill for crypto investing. It helps investors understand price behavior before taking risk. It also supports better research in a market where prices can change quickly.
For deeper crypto guides and practical market explainers, readers can explore more resources on BitCoinBlog. BitCoinBlog continues to publish clear crypto education for beginners who want better research before taking market risk.
Read More:

JAN MATULA
Founder of Bitcion.Blog
Graduate of Bratislava University of Economics and Business, experienced Forex and Stocks trader since 2008, early Bitcoin investor and crypto trader since 2021.
This content is for informational purposes only and should not be taken as solicitation, recommendation, endorsement or investment advice. It is crucial for you to conduct your own research and due diligence to make informed decisions, as any investment will be your sole responsibility. Please review our disclaimer and risk warning.